We may earn a commission if you buy — it never affects which retailer we rank first.
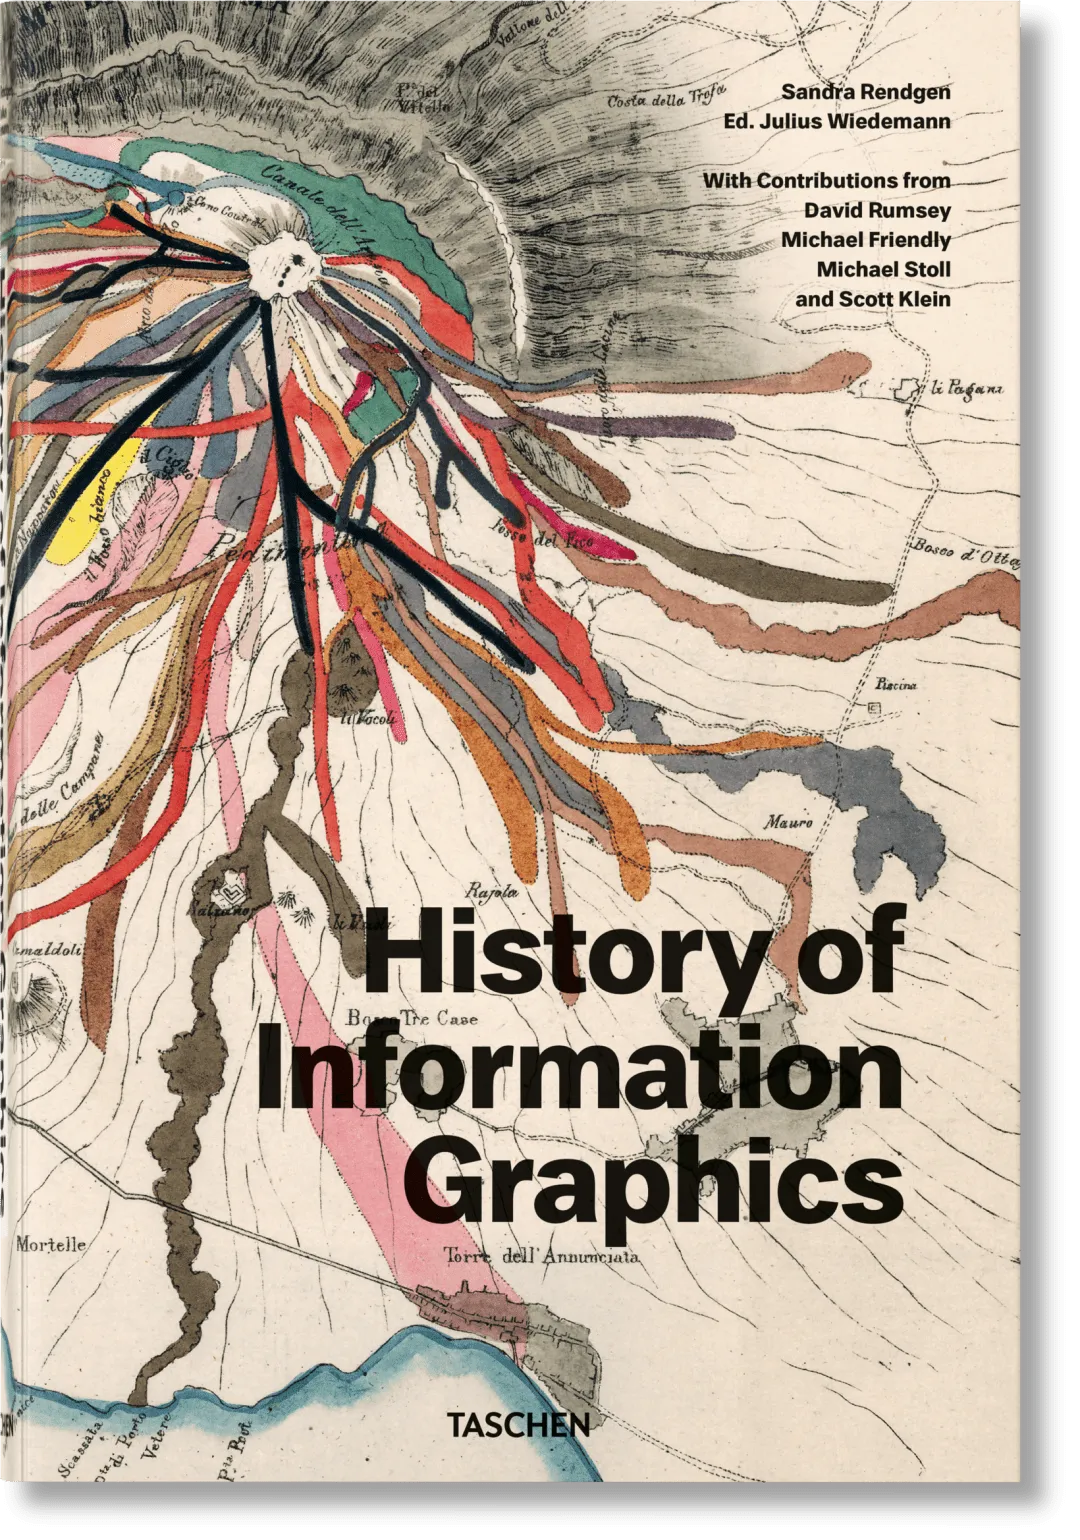
The History of Information Graphics traces the evolution of visual data from the Middle Ages through to the digital era. Featuring approximately 400 infographic milestones, it spans subjects including technology, cartography, and zoology, with references to iconic works such as da Vinci's Vitruvian Man and the New York subway map. Its compendium format provides a structured reference across centuries of data visualisation.
From cosmic charts and da Vinci’s Vitruvian Man to the New York subway map: trace the history of visual data from the Middle Ages to the digital era. Featuring some 400 infographic milestones across technology, cartography, zoology, and more, this compendium is a reference work for designers, history buffs, and anyone thirsty for knowledge.